An uptime monitor requests a URL on a schedule and tells your team when it stops answering the way it should, and again when it is back. Linked to a component of your status page, it also marks that component as down while the outage lasts. It can open an incident for you too.
Add a monitor
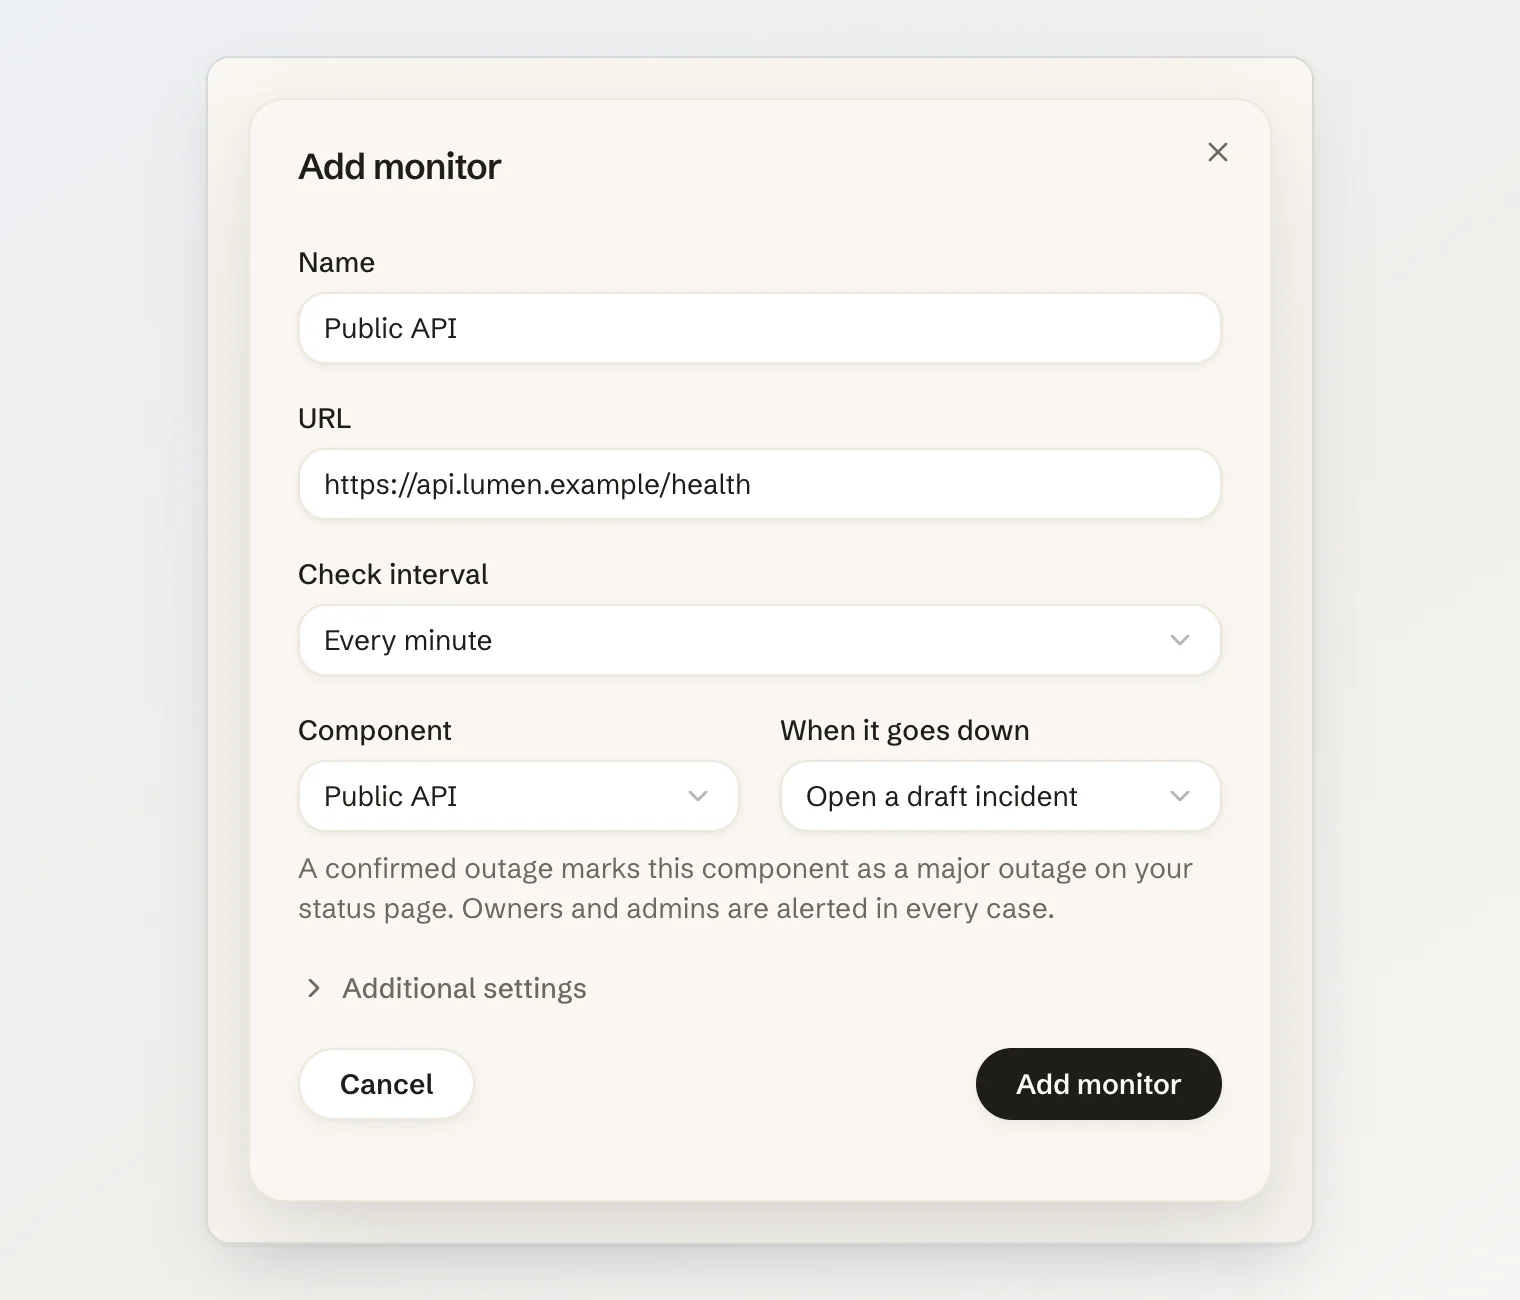
Open Uptime Monitor under Engage and click Add monitor.
Give it a Name and the URL to check. The URL has to be
httporhttps, on port 80, 443, 8080 or 8443, without a user name or password, and on a public address.Pick the Check interval, from Every minute to Every hour. The shortest interval depends on your plan.
Pick the Component of your status page that the monitor stands for, or leave None.
Choose When it goes down: Alert only, Open a draft incident or Publish an incident.
Click Add monitor.
The first check runs within a minute. The monitor shows Waiting for checks until two checks in a row succeed (the second runs 20 seconds after the first) and it turns Up, or until three fail and it turns Down.
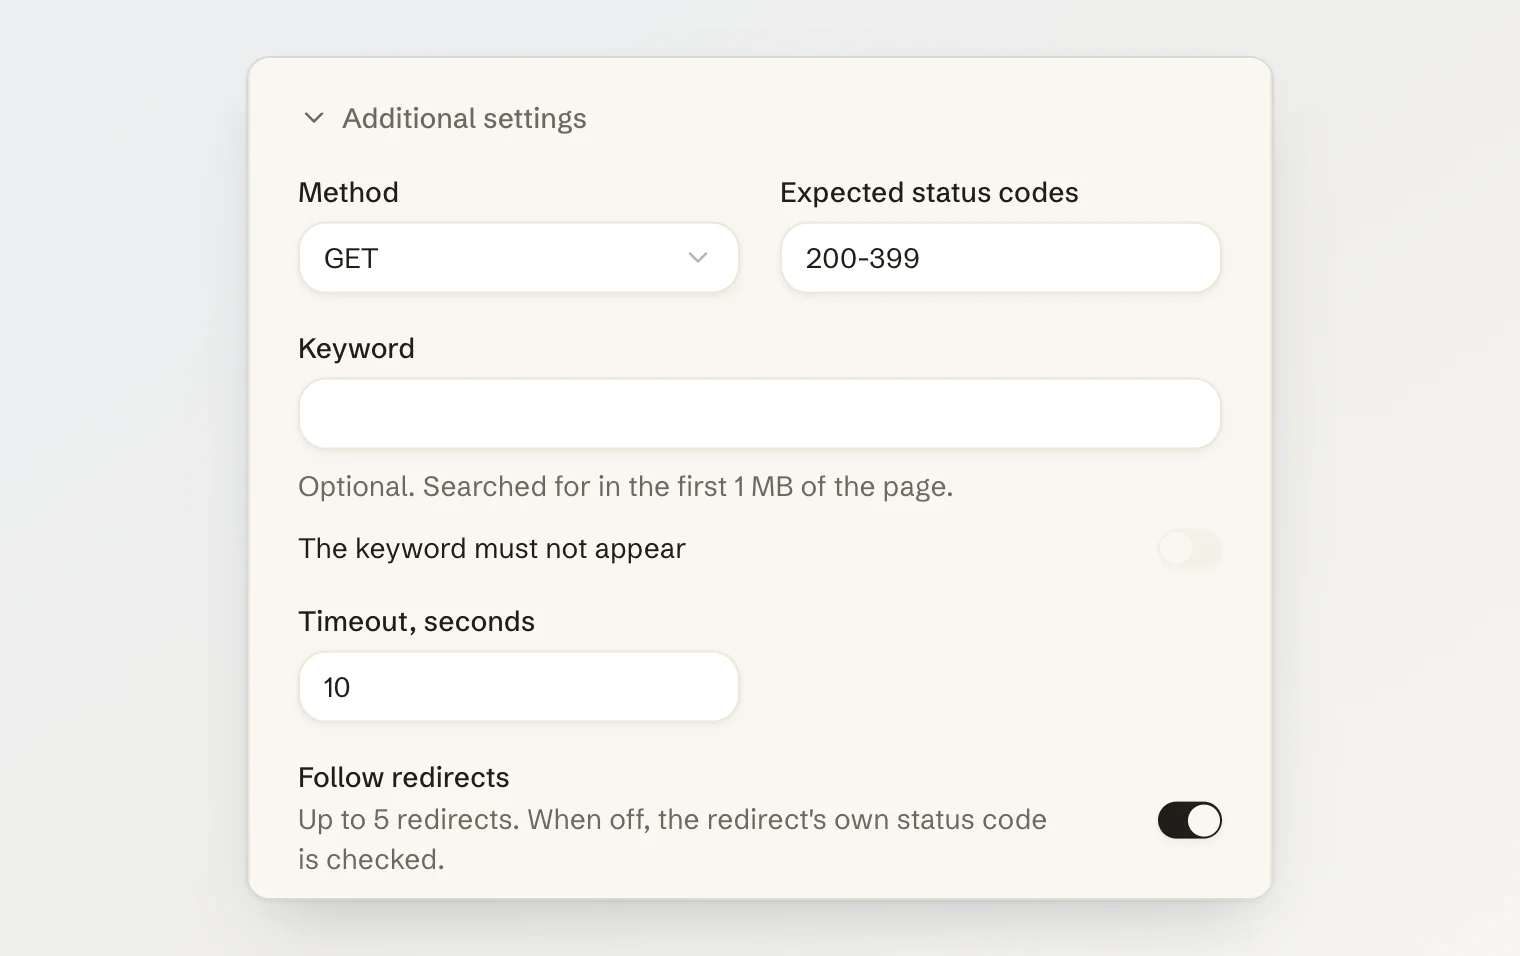
Additional settings holds the rest:
Method: GET, or HEAD for a page you only need the status code of.
Expected status codes:
200-399by default. A list such as200,204or another range works too.Keyword: text the page must contain, searched for in its first 1 MB. Turn on The keyword must not appear to check for an error message instead. A keyword needs the GET method.
Timeout, seconds: from 1 to 30, 10 by default. It covers the whole check, the DNS lookup and every redirect included.
Follow redirects: on by default, up to 5. When it is off, the redirect's own status code is checked.
When a check fails
A failed check is repeated 20 seconds later. After three failures in a row the monitor is Down, and after two successes in a row it is Up again. A success after a failure is also checked again 20 seconds later, so the monitor does not wait a whole interval to come back up.
When it goes down:
Owners and admins of the project get a notification in the dashboard and by email, and another when it is back up.
The linked component shows Major outage on your status page until the monitor is up again. This happens with every When it goes down setting, Alert only included.
Open a draft incident creates an incident named after the monitor, such as "Help center is down", with impact Major and status Investigating, as a draft for you to check and publish. Publish an incident publishes it at once.
When the monitor is back up, Kookee resolves that incident with the update "Help center is working again.", unless someone on your team posted an update on it: then closing it is up to you. If the monitor goes down again within 30 minutes, the same incident opens again instead of a new one.
Webhooks, and Slack, Discord or Telegram integrations, that have
monitor.downandmonitor.upticked get those events.
A monitor that has never been up changes nothing on your status page. It only alerts owners and admins that it is failing, so a typo in the URL never shows your visitors an outage. A monitor whose component is under maintenance holds its outage until the window ends, and shows Held: maintenance meanwhile.
A check that Kookee refused to make, such as a URL that now points to a private address, shows as Configuration error and never counts as an outage.
Read a monitor's page
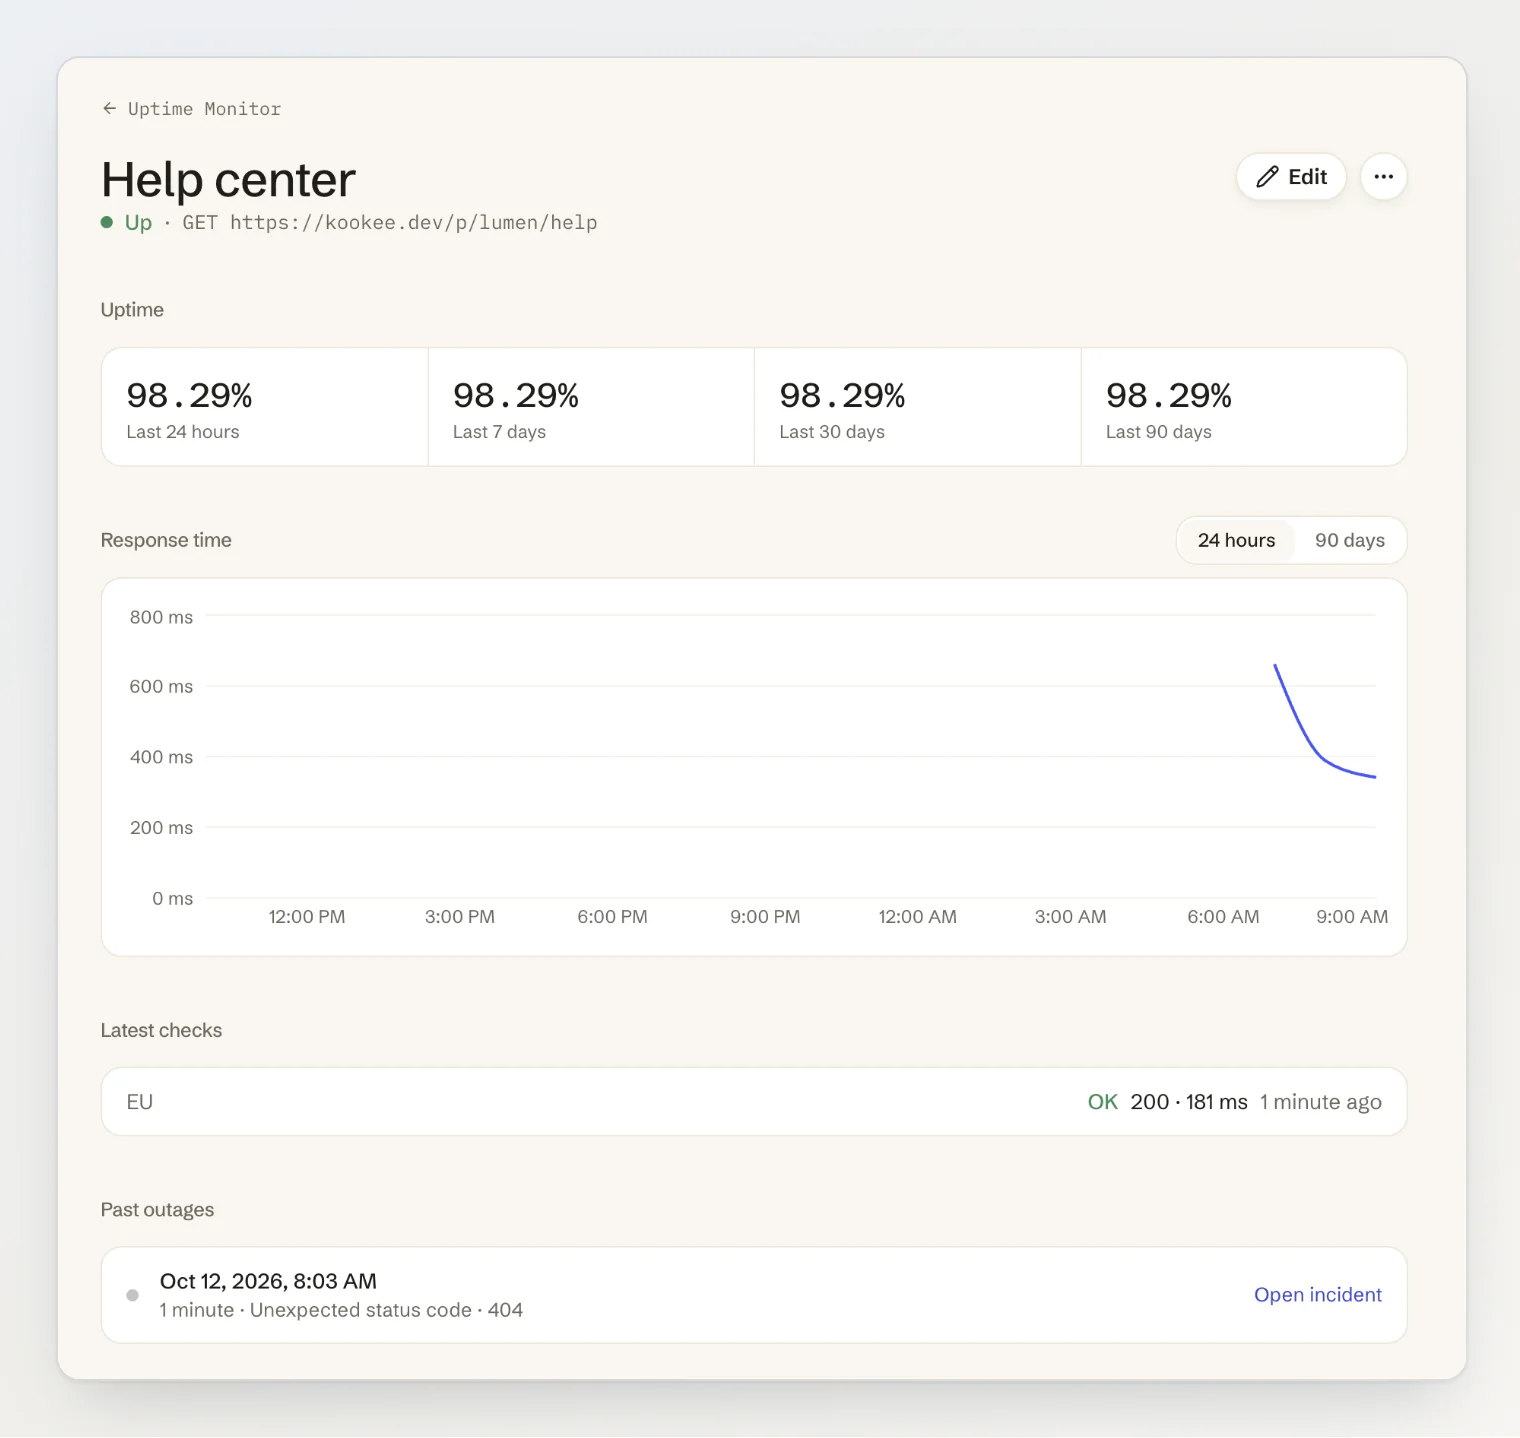
Click a monitor to open its page. It shows the uptime over the last 24 hours, 7, 30 and 90 days, with paused time counted as up. Each figure counts from when you added the monitor, so an outage in its first hours weighs heavily: a 100-second outage in a monitor's first hour shows as about 97%. Below the figures is a chart of the response time: the average of the successful checks, by hour over 24 hours or by day over 90 days.
Below the chart, Latest checks shows the most recent check from each region (only the EU for now): OK or Failed, the status code, how long it took, the error if there was one, and when it ran. Past outages lists when each outage started, how long it lasted, what failed, and the incident it opened. Settings includes the date the site's TLS certificate expires, in amber two weeks before and in red one week before.
Let the checks through your firewall
Checks come from Kookee's servers in the EU with the user agent Mozilla/5.0 (compatible; KookeeUptime/1.0; +https://kookee.dev). Each one also sends the monitor's Verification token, shown on its page, in the X-Kookee-Monitor header, and only to the monitor's own host. A firewall or bot-protection rule that lets requests with that header through keeps your checks from being blocked as bots.
Pause, change or delete a monitor
The menu at the end of each row has Edit, Pause and Delete.
Pause stops the checks and ends an open outage without alerts. An incident the monitor opened stays open, so resolve it yourself. Resume starts the checks again, and the monitor has to be up once more before it changes your status page.
Changing the URL, Method, Expected status codes, Keyword, The keyword must not appear or Component starts the monitor over: an open outage ends without alerts, and the monitor has to be up again, two successful checks in a row, before it can affect your status page. Other changes take effect from the next check.
Delete stops the checks and deletes the monitor's outage history. An incident it opened stays open.
Only owners and admins add, change and delete monitors. Other members can see them.
Limits
Free | Pro | Ultra | |
|---|---|---|---|
Monitors per project | 3 | 20 | 100 |
Shortest check interval | 5 minutes | 1 minute | 1 minute |
Your account can have up to 10 monitors for the same host name across its projects.
What monitors do not do
They make HTTP and HTTPS requests only: no TCP, ping, DNS or heartbeat checks, no custom headers, request body or sign-in.
A slow answer is not marked as degraded. Only a failed check counts.
The certificate's expiry date is shown, but there is no alert for it.
Checks run from the EU only for now.
Continue reading
Set up a status page: components, incidents and maintenance on the page your users see.
Send events to your site with webhooks:
monitor.downandmonitor.upat your own URL.Connect Slack, Discord, Telegram, GitHub, Jira, Asana or Freshdesk: post outages to your team's chat.