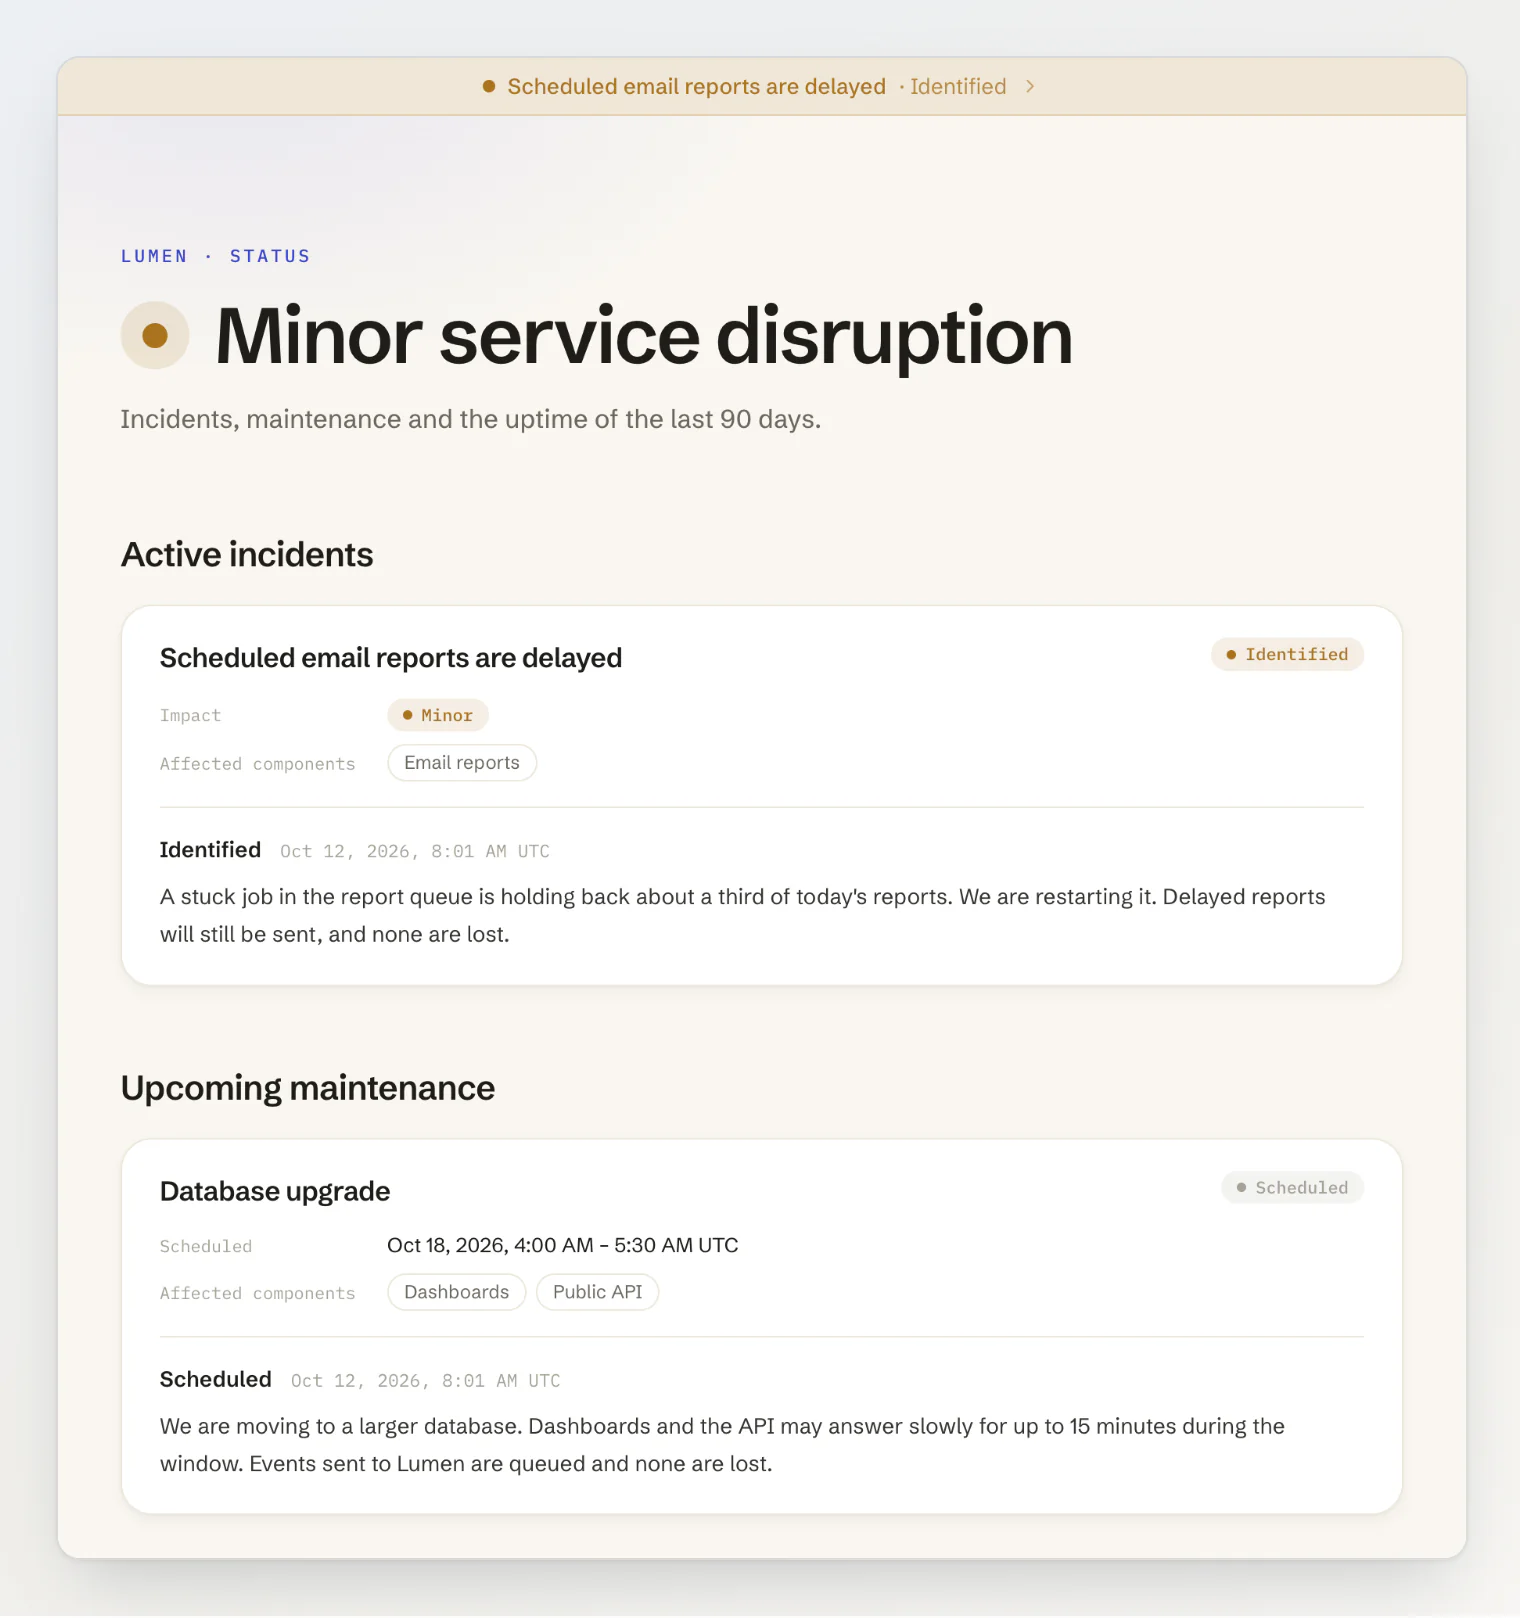
Kookee hosts a status page for your project at <your-project>.kookee.dev/status, on every plan. It lists the parts of your product as components, each incident with all its updates, the maintenance you have planned, and 90 days of uptime per component.
Turn it on
Open Public Portal under Engage. Check that Enable Public Portal is on, and tick Status page under Portal Modules.
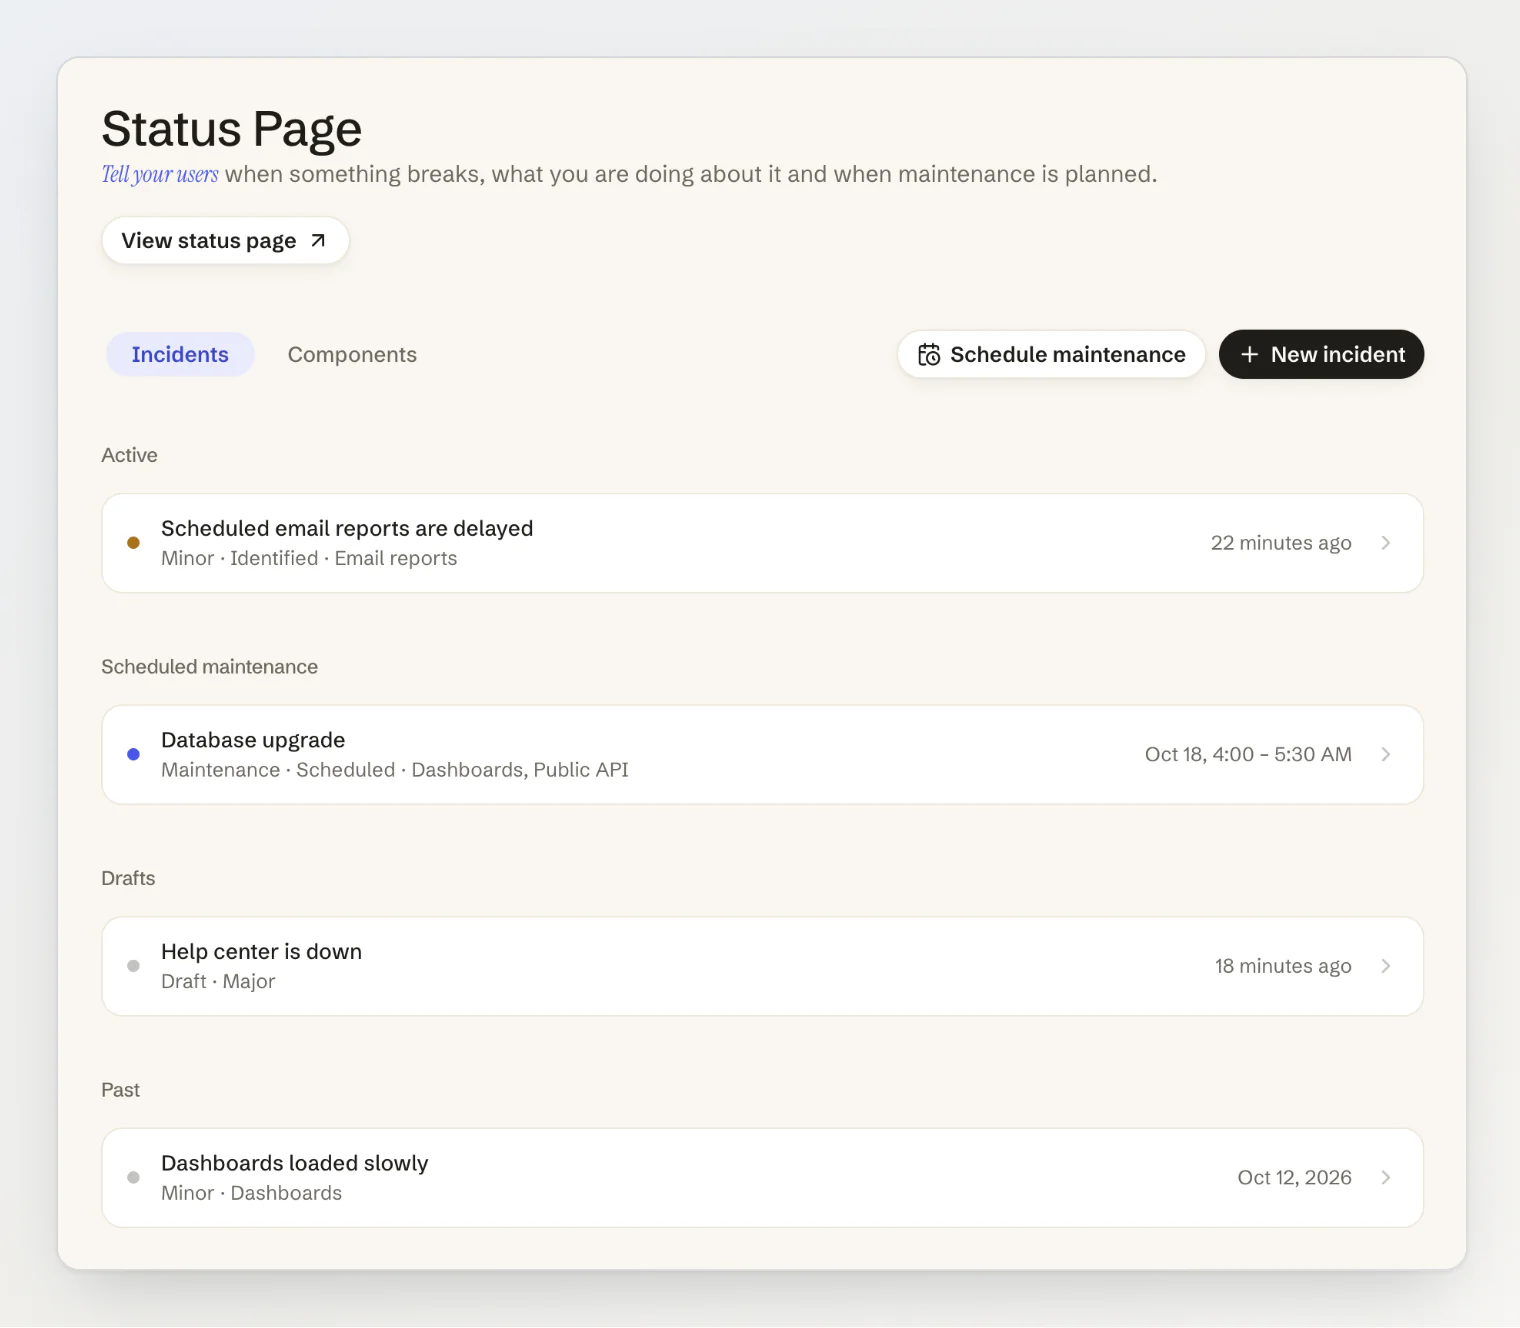
Open Status Page. The View status page button opens the public page.
Until both are on, Status Page shows Your status page is not public yet and the address answers with a 404. You can add components and write incidents before that.
Add components
A component is a part of your product that your users know by name: Dashboards, Public API, Email reports. Name them the way a customer would describe what broke, not after your servers.
On the Components tab, click Add component.
Fill in the Name, and a Description if you want one. Visitors see it under the name.
Status is what the component shows while no monitor and no open incident decides it. New components start as Operational.
Leave Show uptime on to show the component's 90 daily bars and its uptime percentage, or turn it off for a part where a percentage would mean little.
Click Add component.
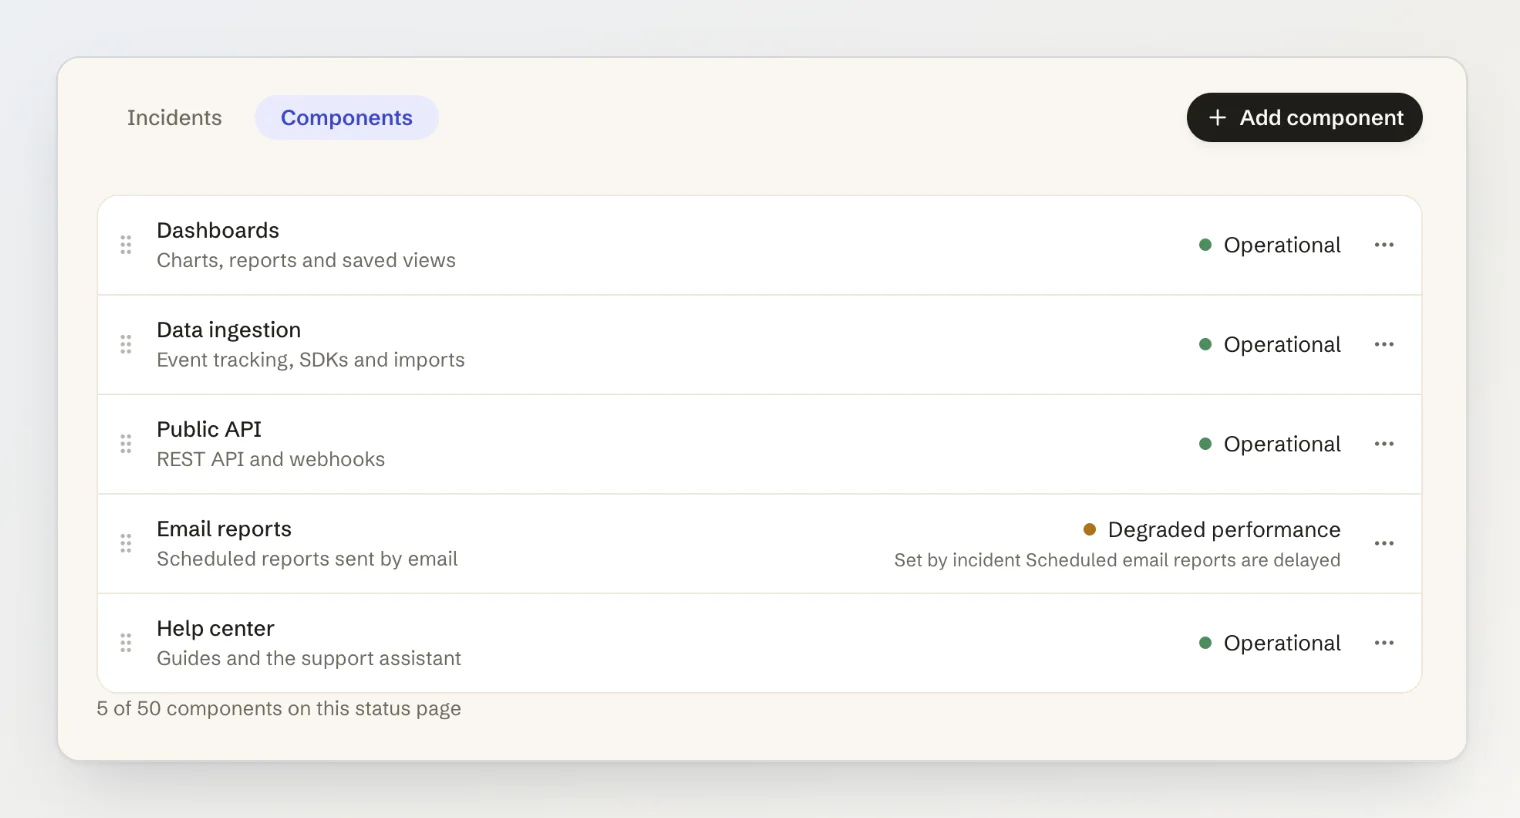
Drag the rows to set their order on the page. A row whose status comes from somewhere else says so: Set by monitor, Set by incident or Set by maintenance, with its name. Only owners and admins add, change and delete components. Every member of the project can post incidents.
Post an incident
On the Incidents tab, click New incident.
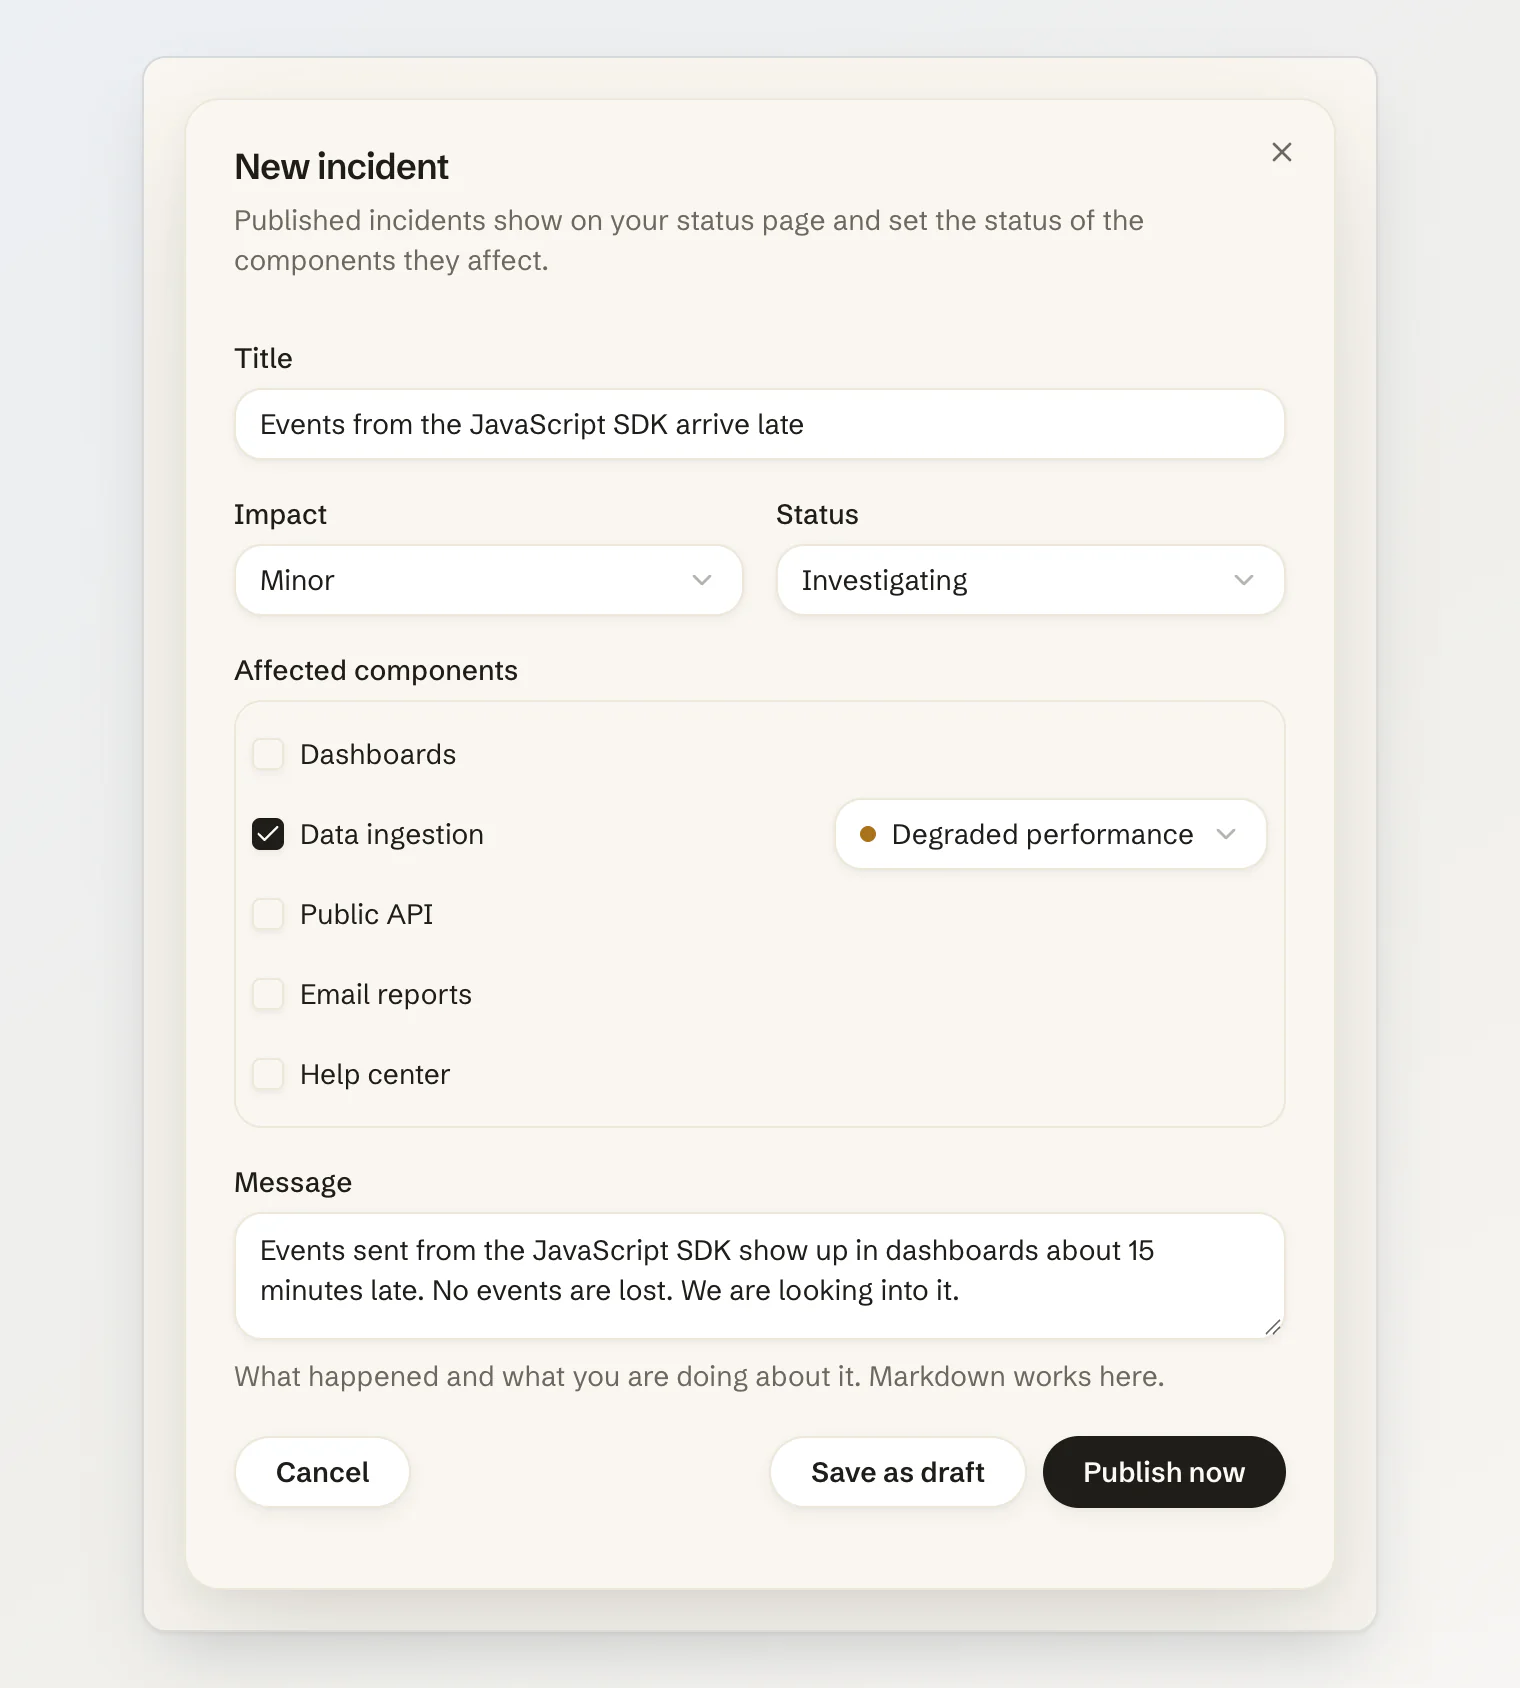
Write a Title your users will recognise, such as "Events from the JavaScript SDK arrive late".
Pick the Impact: No impact, Minor, Major or Critical. Then the Status: Investigating, Identified, Monitoring or Resolved.
Tick the Affected components, and choose what each one shows while the incident is open, such as Degraded performance or Partial outage.
Write the Message: what your users notice and what you are doing about it. Markdown works here.
Click Publish now. Save as draft keeps it for later: a draft is not public, changes no component and notifies no one until you publish it. Drafts wait under Drafts on the Incidents tab; open one and click Publish when it is ready.
The incident goes to the top of the status page, its components show the status you picked (unless a monitor has one down, or another open incident gives it a worse status), and your webhooks and integrations get the event.
Post updates until it is resolved
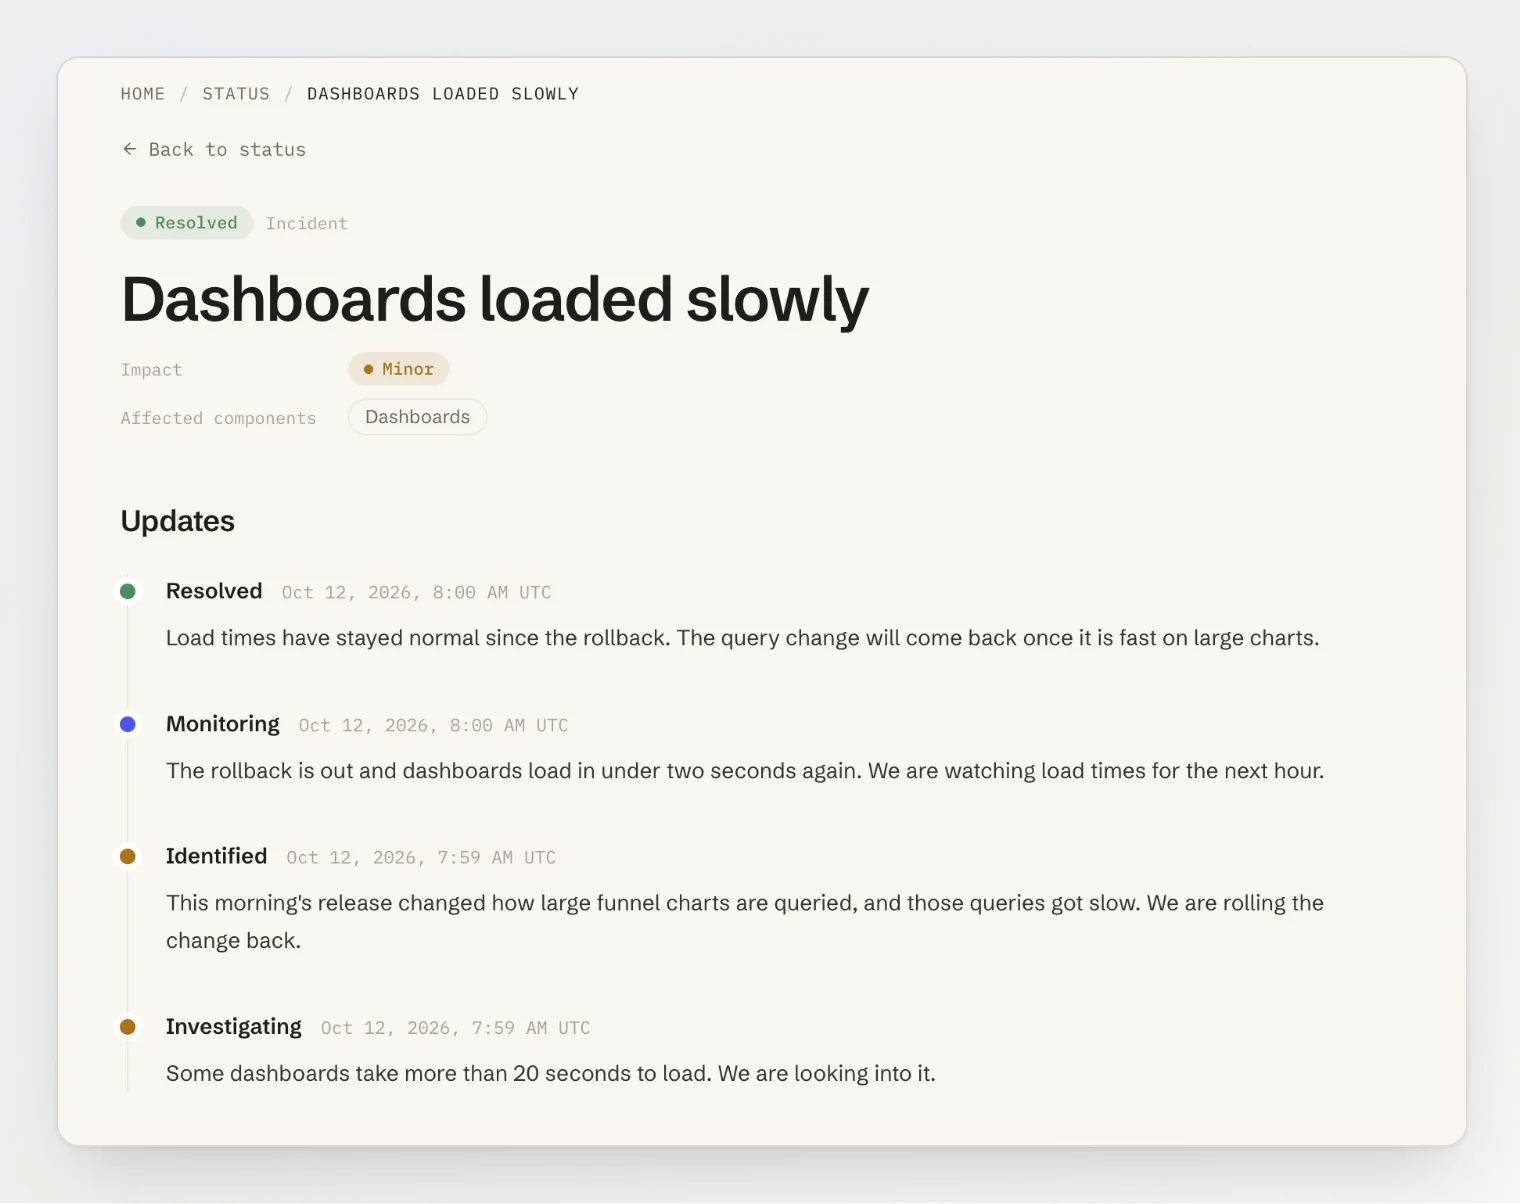
Open the incident from the Active list. Write what changed in the box at the top, set the new Status and each component's status, and click Post update. Each update joins the incident's Timeline, and visitors see all of them, newest first, on the incident's own page.
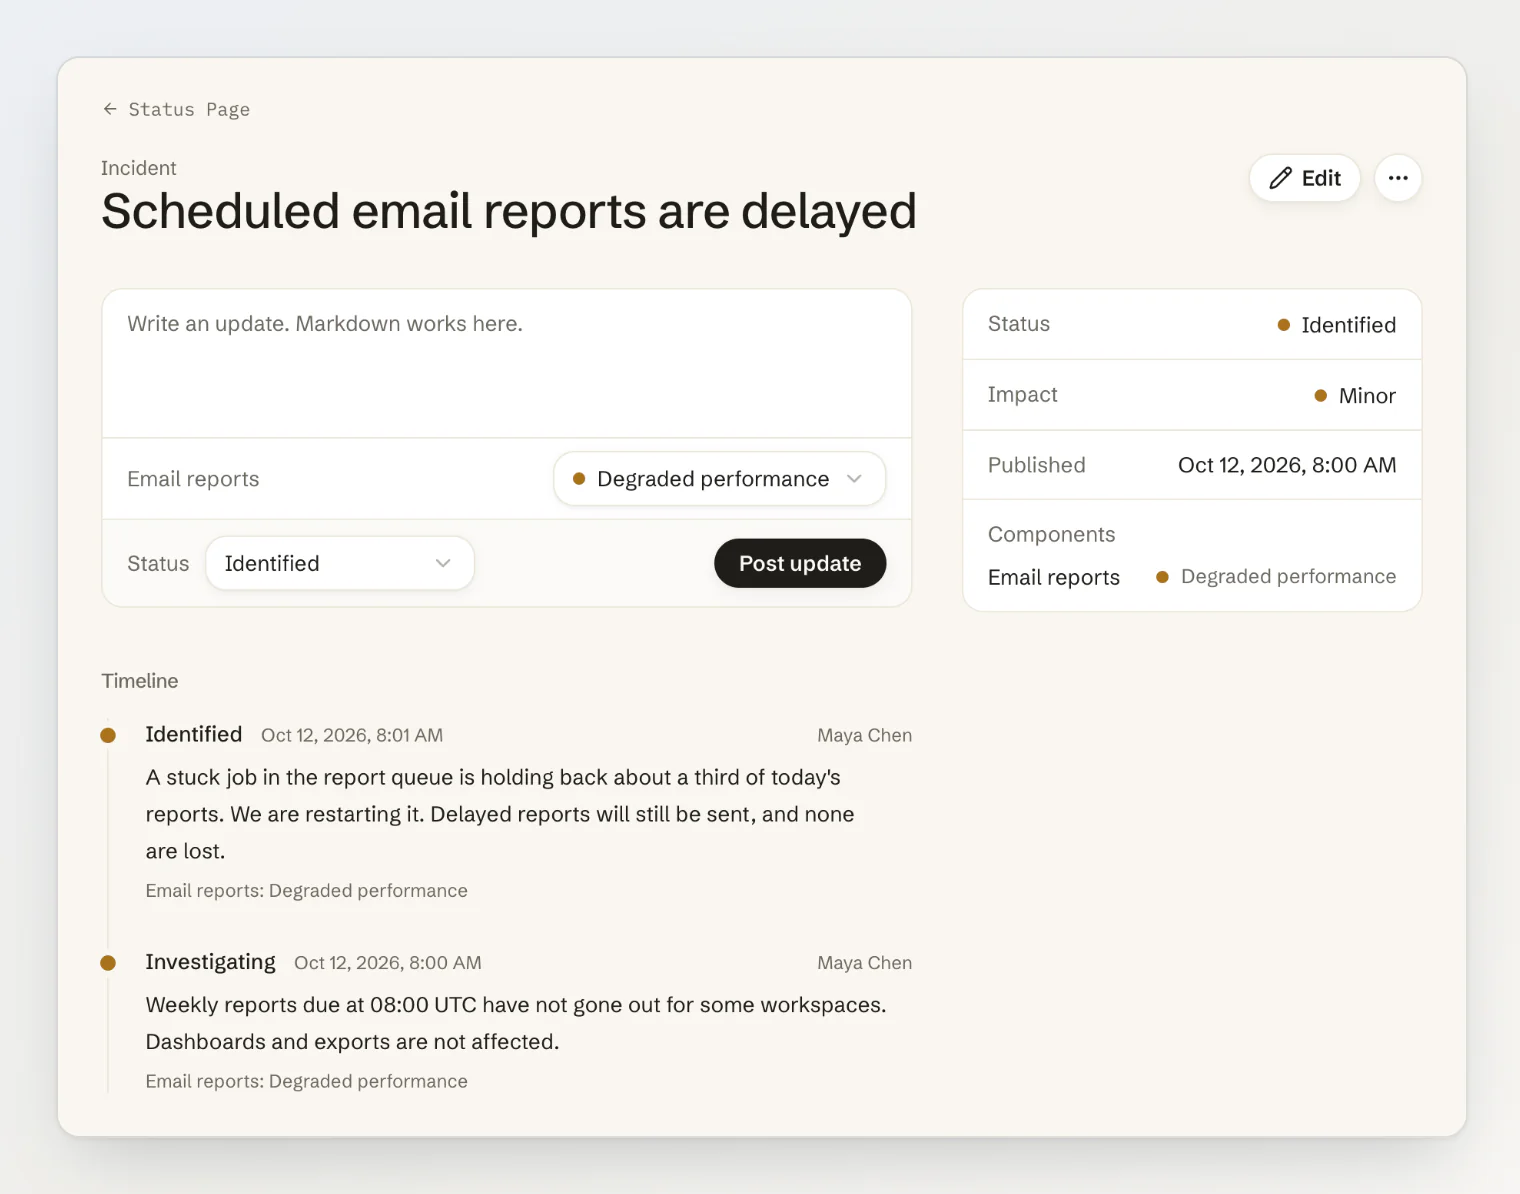
An update with the status Resolved closes the incident. It moves to Past in the dashboard and to Past incidents on the status page, which lists the 50 most recent from the last 90 days. Its own page stays up after that.
Edit changes the title, the impact and the affected components. To change what the incident does to a component, post an update with its new status.
An AI assistant connected over MCP can do this for you: it reads the status, opens incidents, and posts updates. See Managing your content from an AI assistant (MCP).
Schedule maintenance
Click Schedule maintenance, give it a title, the Starts and Ends times, the affected components and a message about what your users may notice. It is public as soon as you save it:
before the start, it is listed under Upcoming maintenance;
between the start and the end, it is in progress and its components read Under maintenance;
after the end, it is completed and moves to the past incidents.
Nothing has to be started or stopped by hand: the window follows the clock. Once the window has started, its start can no longer move, but you can still push the end back with Edit. Post an update with the status Completed to end it early.
What your visitors see
The status page. A headline for the whole page (All systems operational, Minor service disruption, Major outage or Maintenance in progress), then active incidents, maintenance, the components with their uptime, and the past incidents. Times are shown in the visitor's time zone, and the page checks for news every minute.
A page for each incident, with every update.
A banner on every page of your portal while an incident or maintenance is under way.
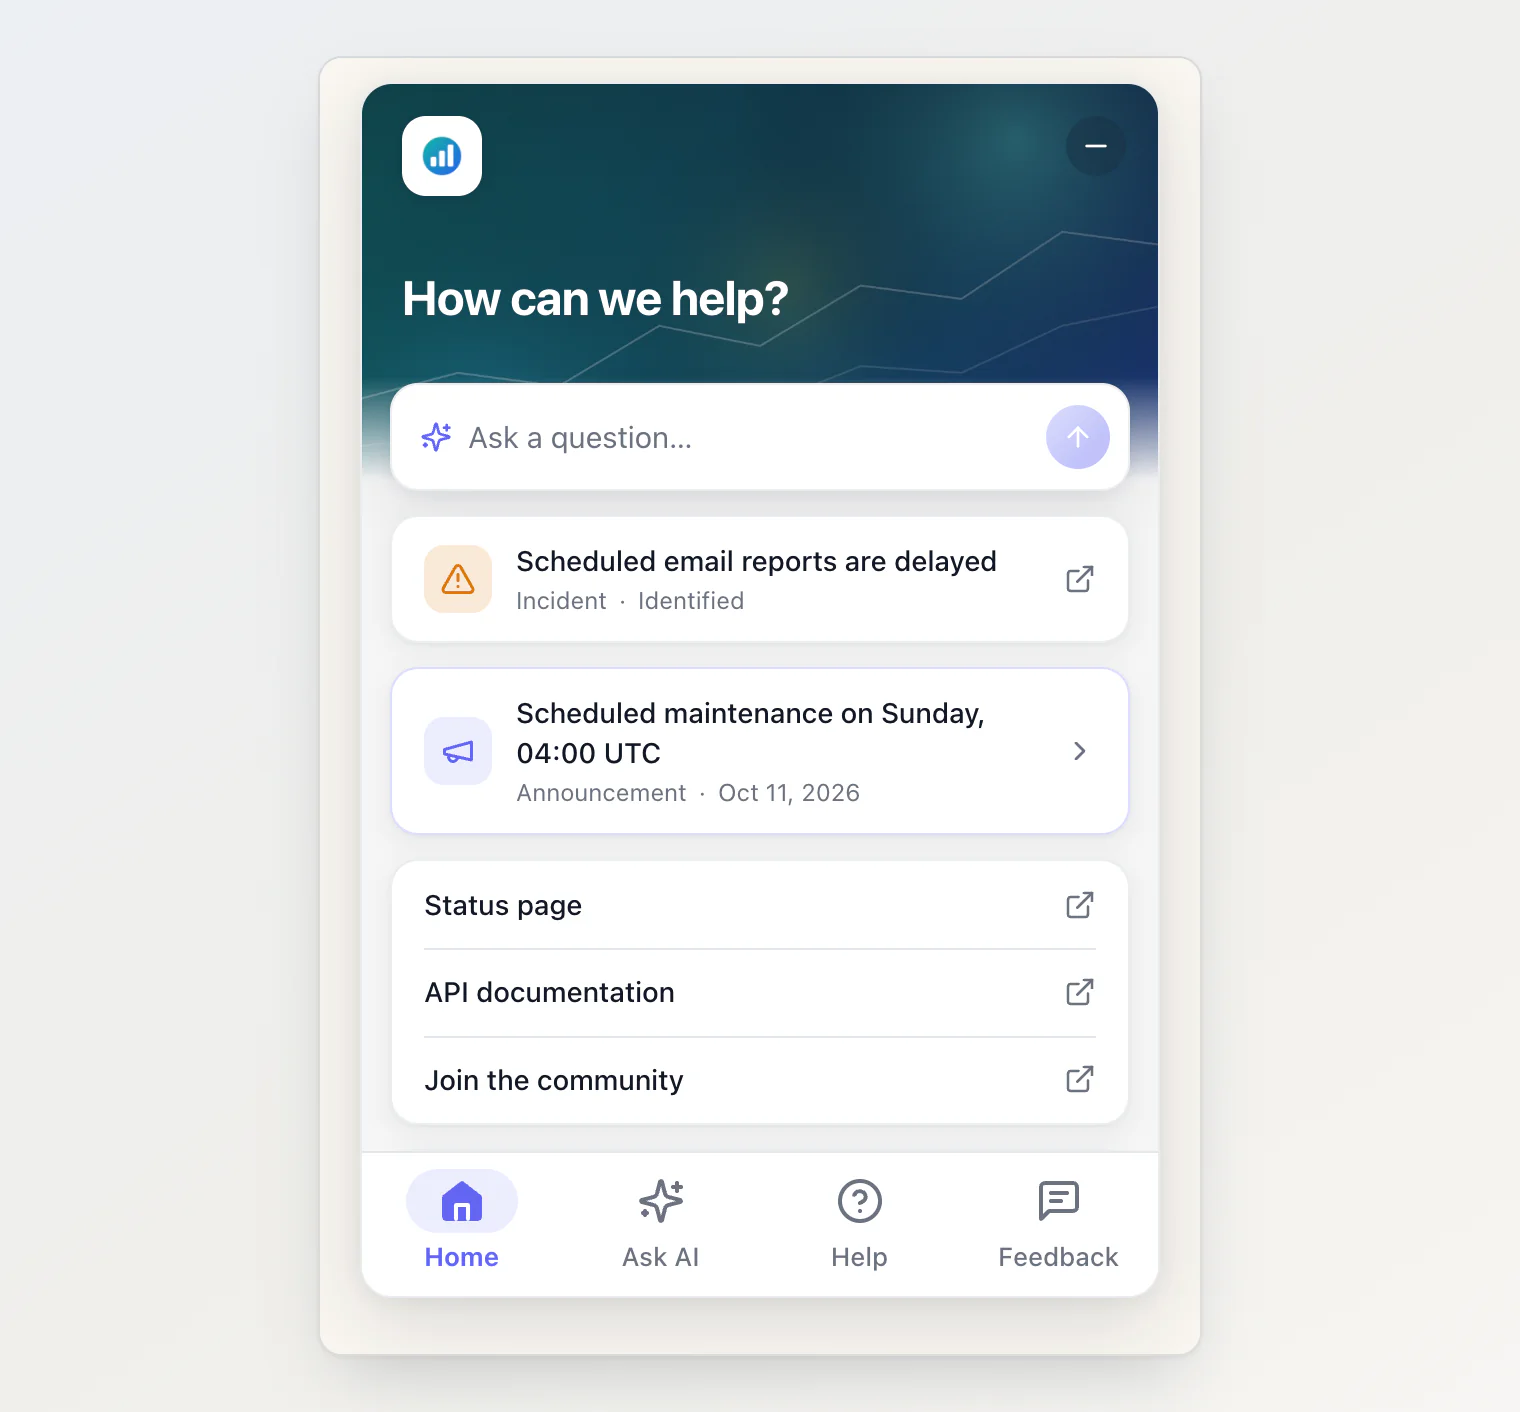
A banner on your site widget's Home tab. It is on by default; the switch is Show active incidents on Home under Site widget → Customize. It needs the Home tab, and
@kookee/react1.18 or later on sites that install the widget from npm.Answers from the widget's AI chat that take active incidents, maintenance in progress and maintenance starting within 24 hours into account.
How uptime is counted
Each component has a bar for each of the last 90 days, in UTC. A day takes the colour of the worst status the component had that day. Days before you added the component are grey, and the percentage counts only from then. Only time in Major outage counts as downtime: Degraded performance and Partial outage colour the day but leave the percentage alone. The percentage is rounded down to two decimals, so 99.996% shows as 99.99%.
A monitor can set a component's status for you when the site behind it goes down: see Monitor your site with uptime checks.
Limits
Free | Pro | Ultra | |
|---|---|---|---|
Components per project | 10 | 50 | 200 |
Incidents per project | 1,000 | 25,000 | 250,000 |
An incident holds up to 200 updates. Maintenance windows, drafts and incidents opened by monitors count as incidents.
What it does not do yet
Visitors cannot subscribe to updates by email or RSS.
The hosted page lives at
<your-project>.kookee.dev/status; Kookee does not host it on a domain of your own. To show it on your own site, use the React components or the API: see Show your status page on your own site.An incident is shown in the language you wrote it in. The page's own texts, such as headings and statuses, follow each visitor's language.
Status pages are public. There is no private page for a team or a customer.
Continue reading
Monitor your site with uptime checks: check a URL on a schedule, alert your team, and open an incident if you let it.
Show your status page on your own site: the same page on your domain, with the React components.
Send events to your site with webhooks: get incident and monitor events at your own URL.